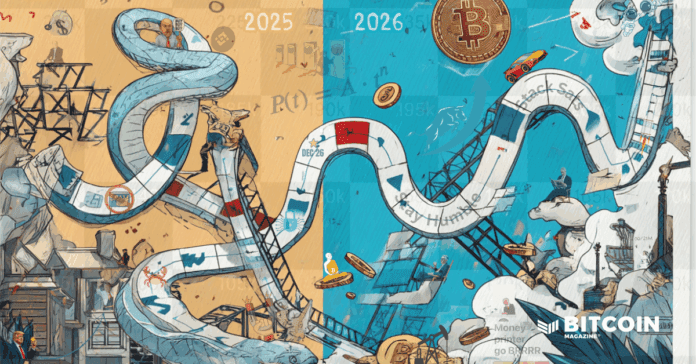
We had high hopes for the bitcoin price in 2025. It was supposed to be the crescendo of the four-year cycle, the most bullish setup in recent memory. It was the year after the halving, the ETFs had just been approved, a new president was elected, with the promise of the money printer roaring back to life. Everything looked primed for a Q4 blow-off top, and instead of a new life in Monaco, all you got was this lousy article.
What follows is my interpretation of the events of 2025 and my outlook for 2026. I’m not a trader, not an analyst, and like you, I’ve been outperforming professional funds for years, by simply stacking Sats, of course. I’m more of a “fix the money, fix the world” kinda guy, but like everyone else, it’s hard to ignore Bitcoin’s price movements, which I think of as the game of “Snakes and Ladders”.

In the game of Snakes and Ladders, momentum drives us forward, but it can also provide a false sense of confidence. You can be one roll away from victory, only to land on a snake that sends you sliding back ten places. As much as hopium dictates that we pray for the price to go ‘up and to the right’, markets rarely oblige. Switching from the board to the chart, price action is played on a board of global liquidity and market sentiment. When sentiment is low or liquidity dries up, no amount of good news can sustain momentum. We simply crab sideways or find a snake that slides us down into further despair.
On the other hand, when liquidity floods the system, we often find the ladders that shoot us through resistance levels. For most of 2025, we were stuck playing the former, while dreaming of the “ladder”. So let’s take this time to review 2025 from the perspective of hindsight, as foresight proved to be of little benefit.
What Happened To Our 2025 Bull Run?
If there is a phrase that defines the Bitcoin market of 2025, it is exactly that: a Year of Snakes and precious few ladders. Interestingly, and unbeknownst to me, 2025 was indeed the year of the snake according to the 12-year Chinese zodiac cycle, starting January 29, 2025, and ending February 16, 2026.
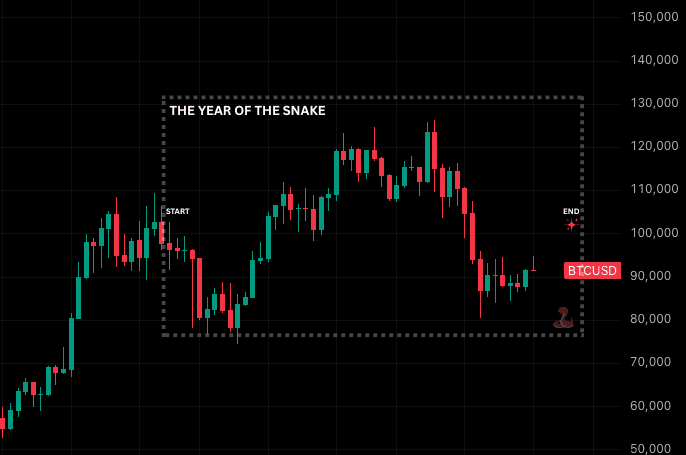
We began the year with the kind of euphoria that usually marks a cycle top. The halving was behind us, and the political stars had aligned perfectly. Google trends showed search queries were soaring. In fact, the year kicked off with a quiet but massive victory before the political fireworks even started: FASB fair value accounting rules took effect on January 1st, finally allowing companies to report bitcoin profits rather than just losses.
Then came the main event. We witnessed the inauguration of a “Bitcoin President.” Gary Gensler departed, leaving behind a legacy that, in hindsight, was perhaps less villainous than we assumed, and Ross Ulbricht walked free within 48 hours. With the new administration came a few allies: Paul Atkins took over the SEC and Mike Selig the CFTC, securing a pro-crypto cabinet.
The financial plumbing was finally completed. The ETFs were fully operational, options trading on IBIT were unleashed, and it quickly became clear that Michael Saylor was not about to let Larry Fink steal his thunder. MicroStrategy went on a $25 billion buying spree, 100x what they bought in 2020, and the corporate treasury list exploded from 60 companies to nearly 200.
By October, the engines were well and truly revving. We hit the All-Time High on October 6th, ready to punch the accelerator for the glorious Q4 end-of-cycle run. Instead, we shifted the gear into reverse and slid all the way down to $80,000.
First, we got our knickers in a twist over the “Knots vs. Core” drama. Then came the Binance incident, where the snake manifested itself as a “technical issue” at precisely the wrong time, and right as Gold broke out. We essentially got rug-pulled by a glitch. The issue of October 10th likely created added sell pressure through forced liquidations, whilst also triggering the 4-year cycle sellers who have been trained to sell Q4 of the 4th year. Few understood the gravity of it at the time, though I tip my hat to Jesse Olson for calling it early.
Then the FUD machine was turned on. First, it targeted MicroStrategy with threats of MSCI exclusion; it didn’t help sentiment that its mNAV has been dropping all year. Then it pivoted back to Bitcoin with the return of the “quantum attack” narrative.

While the headlines swirled, the bitcoin price became stuck in purgatory, range-bound between $84,000 and $95,000 and trapped by options traders, even though the handcuffs had theoretically been taken off IBIT options earlier in the year. Bitcoin was having an Austin Powers moment, while Peter Schiff enjoyed his first day out in the sun since high school. Bless him.
Is The Tide About to Turn?
While some fear 2026 will bring the hangover of a post-cycle bear market, I, like countless other optimists believe otherwise. If 2025 was the year of snakes, 2026 is the year we finally climb a few ladders.
The setup is favourable. We have a Bitcoin-ish president, who’s hungry to fire up the printing press, we’ve a developing multipolar world, where the process of game theory should be heating up, there’s a $7 trillion debt wall to be paid, the old guard are positioned, the regulation stranglehold has been loosened, the cowboys (FTX, Terra-Luna, etc.) are gone, gold and silver have both had their runs, and Bitcoin’s supposed to follow next, or so we hope.
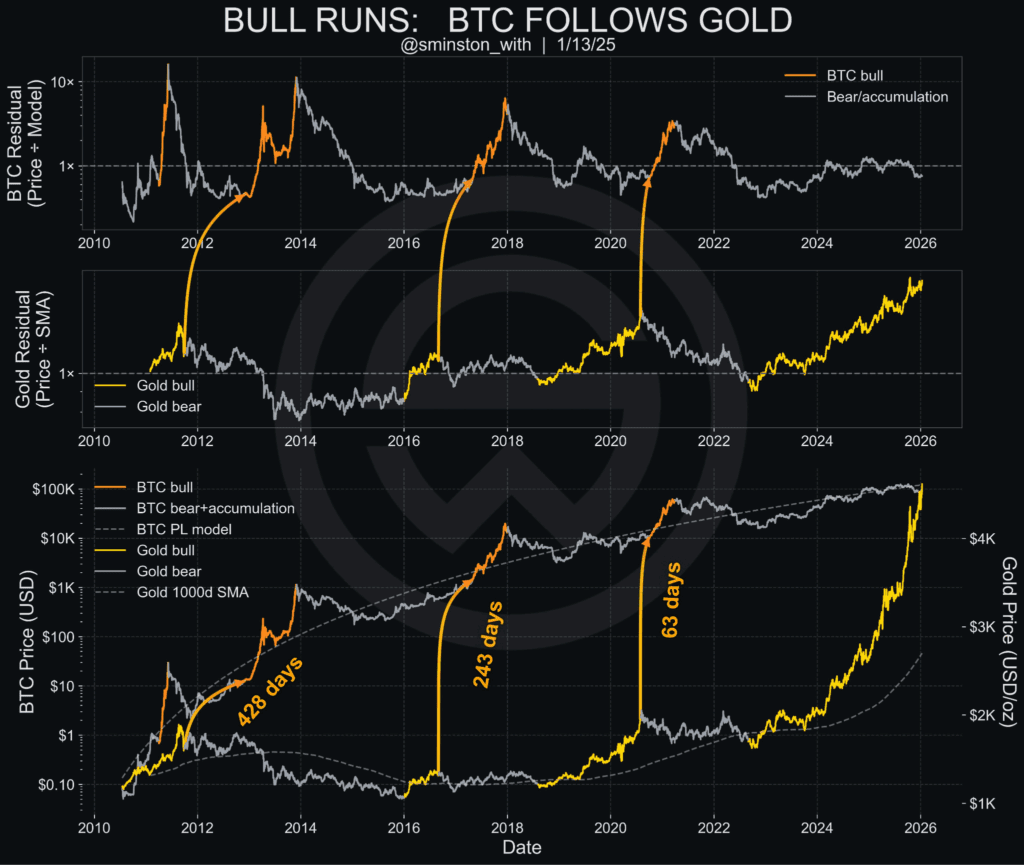
Source: Sminston With
Not to mention, the tax year is done, and new budgets have been allocated to fund managers and businesses alike. FASB fair value accounting is now live, smoothing the runway for corporate balance sheets. Michael Saylor is still buying with the relentless intensity of a man who understands math better than Archimedes. Even the “MSCI FUD” was defeated early, so credit to George and the Bitcoin for Corporations team for that victory.
At the point in time as the price is beginning to climb higher, the bears are finally showing signs of exhaustion, that’s according to James Check and countless others. By far the most significant headwind Bitcoin faced in 2025 was the relentless onslaught of coins sold by long-term holders. That pressure looks to finally be ending. On November 1st, approximately 67% of the Realised Cap was invested above $95k. The last two months have seen a massive supply redistribution occur, with that metric declining to 47%.
Over the last 30 days, around 80% of the coins which have transacted came from higher prices. This is the definition of capitulation. The weak hands who bought the top have flushed out, and new buyers have stepped in with a lower and stronger cost basis.
Incidentally, the Year of the Snake officially ends on February 16, 2026, to be followed by a horse, which as we all know has the ability to outrun any bull. This coincides almost perfectly with the monthly CME Futures expiry on February 27th. The shedding of a snake’s skin happens right before the growth returns.
Is the 4-Year Cycle Dead?
Really, who can truly say they know? What we do know is that the four-year cycle is no longer connected to the halvings or the presidential cycles in the way we once thought, and the halvings are less likely to have an effect going forward, as the new coins distributed are a lower percentage of supply, and the miners are supported by huge funds which can help them weather any potential death spiral.
We have not seen a Pi Cycle top signal, the 200 week moving average has not crossed the prior cycle top, the MVRV score is just 1.3, the Puell multiple is just .99, we’ve not had a considerable drawdown, and we’re still at the bottom of the range of almost every metric imaginable. For those of you who are old enough to remember the KitKat ad from the 90’s, “the 4 year cycle is not dead, it was just takin’ a break.”
As the 4-year cycle is a purely Liquidity Based Cycle, it can be measured by proxy using the ISM Manufacturing PMI, a qualitative index sourced from purchasing managers in the manufacturing industry. I give credit to Raoul Pal for highlighting this metric; he was the first I observed to point out that bitcoin is a “Liquidity” asset rather than a “Halving” asset. Bitcoin, as the highest-beta risk asset in existence, responds to shifts in global risk appetite with greater force and speed than any other asset class. The PMI tracks the business cycle, and it has been in contraction for nearly two years. The current PMI at 47.9 signals ongoing contraction, but ISM projections indicate a 4.4% revenue growth for manufacturing in 2026, crossing 50 in Q2 as Trump’s policies kick in. The bitcoin price should follow. When the ISM PMI is below 50, we’re generally in a bear market, and we’ve been that way for over two years now. The bull markets have historically topped out between 55 and 65. The question remains, when is the business cycle going to see an upturn? TechDev is of the view that it’s happening very soon, as the bullish divergence reversal momentum is decidedly building.
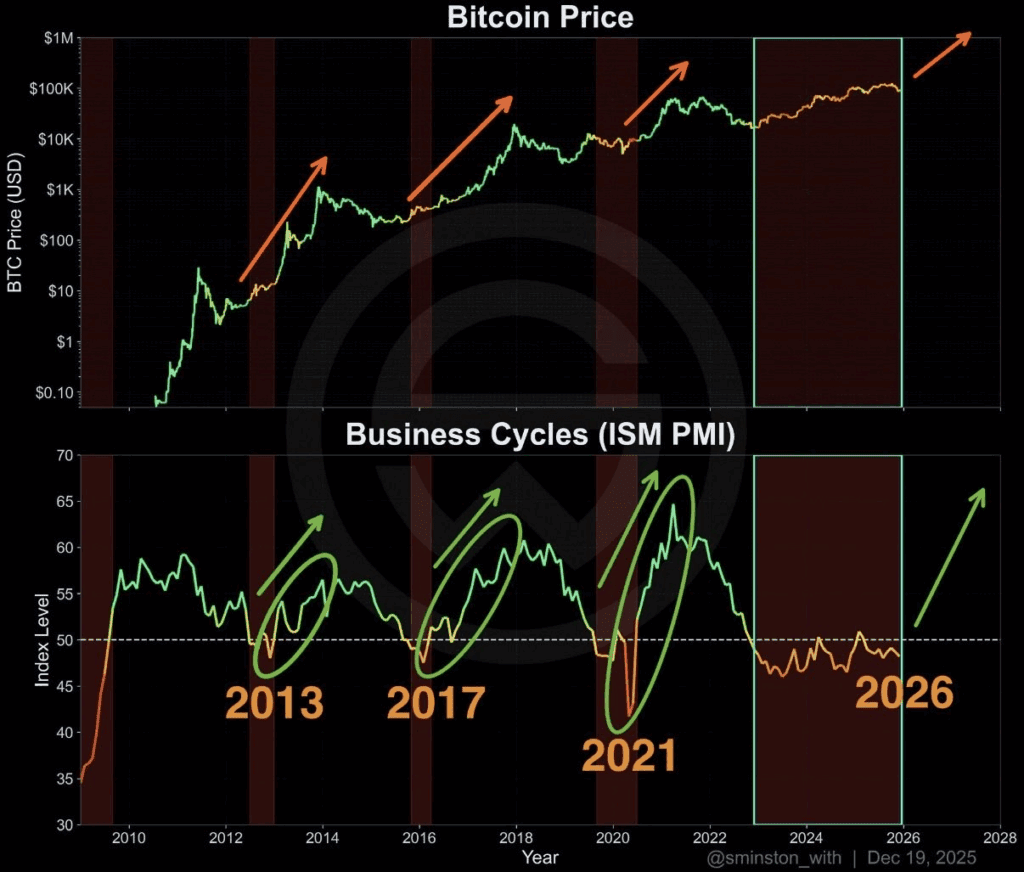
Source: Sminston With
The $9 Trillion Debt Question
The US government has to address the $9 trillion debt wall that’s due to mature this year. But the nuance is in how they do it. President Trump has made it clear he intends to build a “Dream Military” for 2027 and is pushing for a budget increase to $1.5 trillion. When you combine that with the $4.1 trillion of debt maturing in 2026 and the standard annual deficit, the US Treasury faces a $9 trillion liquidity gap, and a further $7.4 trillion before 2028.
Does the US have to print all $9 trillion? No. And through this lens, the recent geopolitical moves make sense. Trump didn’t only capture Maduro for a photo-op; he has likely taken control over 303B barrels of reserves and is enforcing USD oil sales, creating artificial dollar demand and easing the liquidity gap by $2-3T annually.
Can he cover the gap via a mix of tariffs (that Americans actually pay for!), Petro-Dollar demand, and the inevitable monetization of the rest by the Federal Reserve? I guess he’ll have to. With Jerome Powell expected to leave his chair in May, the path will be cleared to give the printer engines a whir.
There’s another $5 – $10 tr due globally in 2026, and the same again in 2027. So the fed chair won’t be without company.
My View: 2026–2027
The four-year cycle OGs may be stepping aside, but the Liquidity Cycle is just gearing up, and Bitcoin, as Raoul Pal has long argued, remains the ultimate liquidity barometer.
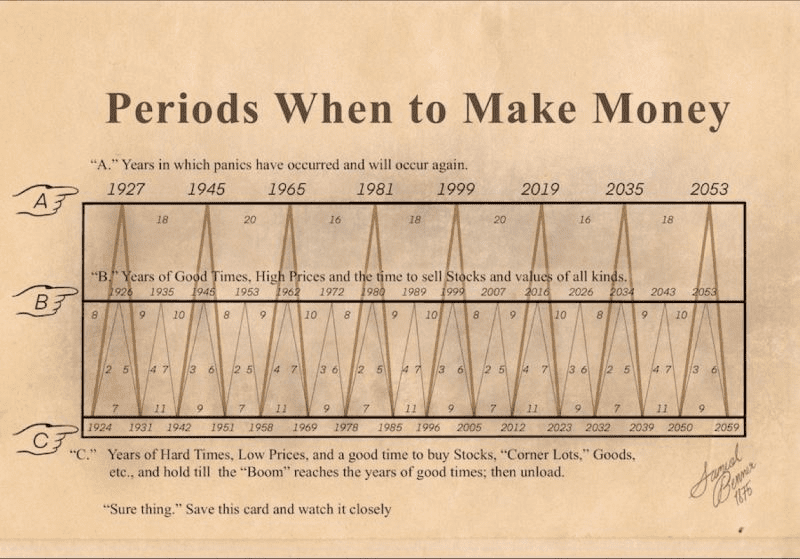
Samuel Benner’s famous 19th-century forecasting chart (first published in 1875), maps long-term cycles of panics (“A” years), booms/high prices (“B” years), and depressions/low prices (“C” years). Interestingly, 2026 falls squarely in one of Benner’s “B” years, which is a period of “Good Times, High Prices and the time to sell Stocks and values of all kinds.” The chart places 2026 right alongside previous boom years like 2016, 2007, 1999, and 1989, suggesting we are entering a structurally favorable window for risk assets.
How Long Will The Next Money Printing Last?
Prediction: 18–24 months
Why: History shows that once the dam gates open, it takes roughly two years to stabilize and reflate. If the official aggressive printing phase begins in late 2025 (as the liquidity uptick and Benner timeline imply, and as M2 shows), it will likely run strong through mid-2027.
How Much LIquidity Will Be Added?
Prediction: ~$9–$10 trillion in the U.S. Treasury debt is maturing in 2026 alone (about one-third of outstanding marketable debt) and a further $5 – $10 tr globally.
Why: As discussed above, the maturity walls for 2026 are nearly double what we faced during the COVID crisis. Yellen extended the pain by leaning on short-term issuance back then, but come hell or high water, that debt has to be paid or refinanced—the money will arrive from somewhere. Because of this, we can expect a new wave of inflation, the 70’s and 80’s have a story to tell about that!
How High Will The Bitcoin Price Go?
Prediction: $250,000
Why: During that $5 trillion COVID expansion, BTC rallied roughly 20x from the $3k–$4k lows to $69k. With the potential for double that liquidity entering the system this cycle, the upside is significant even if diminishing returns apply. From our $16k effective low, a conservative 10x to 12x multiple lands us in the $160k to $200k range as a base case. However, models suggest we could push higher. PlanC’s quantile model points toward $300k+ by the end of 2026, and Giovanni Santostasi’s Power Law projects a peak potentially around $210k early on, with room to stretch as high as $600k in outlier scenarios. But hey, I was expecting +$200k last cycle too.
Oh, if the Strategic Bitcoin Reserve Act moves out of the committee, and if the U.S. Treasury officially starts side-stacking alongside MicroStrategy, all bets are off the table.
When Will The Price Top Out?
Prediction: Late 2026 to mid-2027
The Logic: Bitcoin historically tops out 12–18 months after the liquidity expansion enters its “mania” phase. If the ISM Manufacturing PMI crosses back above 50 in early 2026, the perfect storm should unfold throughout 2026, setting up a blow-off top, potentially in the first half of 2027.
Bitcoin is unlikely to go straight up, nothing ever does. We’ll almost certainly encounter a few snakes along the way: sharp corrections, regulatory noise, profit-taking, or some form of shenanigans. But the ladders are built, ready and waiting. The Year of the Snake is coming to an end, just ahead of the February 27 CME futures expiry, our potential ignition point, right before the anticipated PMI uptick in Q2.
2025 was a year of snakes and sideways pain, with long-term holders finally capitulated and weak hands flushed out. Now, with a wall of liquidity heading our way, 2026 looks like the ladder we’ve been waiting for. The horse year is coming, so stack and secure accordingly.
Good luck.