The bitcoin price is at a very interesting point in its current market cycle. With lots of different opinions and not much movement in price, it’s hard to know what’s coming next. But when we look at the important data, things get a lot clearer. These signals don’t just tell us what might happen in the immediate future, but can clarify what the coming weeks and months could bring.
Table of Contents
- The Short-Term Holder Realized Price and Bitcoin Price Support
- Understanding The MVRV Ratio and Bitcoin Price Valuation
- Long-Term Holder MVRV and Bitcoin Price Peaks
- The Rolling MVRV Framework and Bitcoin Price Dynamics
- Conclusion
The Short-Term Holder Realized Price and Bitcoin Price Support
We begin with the Short-Term Holder Realized Price, effectively the average cost basis for new market participants. This level has historically acted as a dynamic zone of support and resistance throughout each cycle. At present, the STH realized price sits around $113,000, close to where Bitcoin is currently trading. Despite the sharp liquidation event earlier this month, the market has rebounded and stabilized around this level.
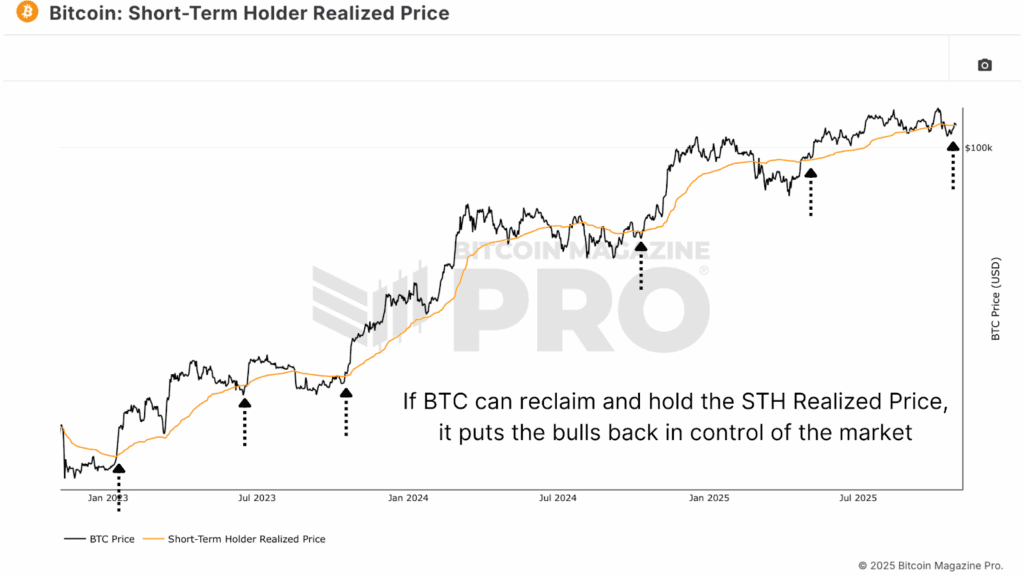
When Bitcoin holds above the short-term holder realized price, it signals that the average recent buyer is either at breakeven or in slight profit. This often increases investor confidence and encourages additional capital rotation into the market. In past cycles, such as in 2017, every retest of this line provided an ideal accumulation opportunity before the next leg higher. Maintaining support above this could once again mark the foundation for the next phase of the bull cycle.
Understanding The MVRV Ratio and Bitcoin Price Valuation
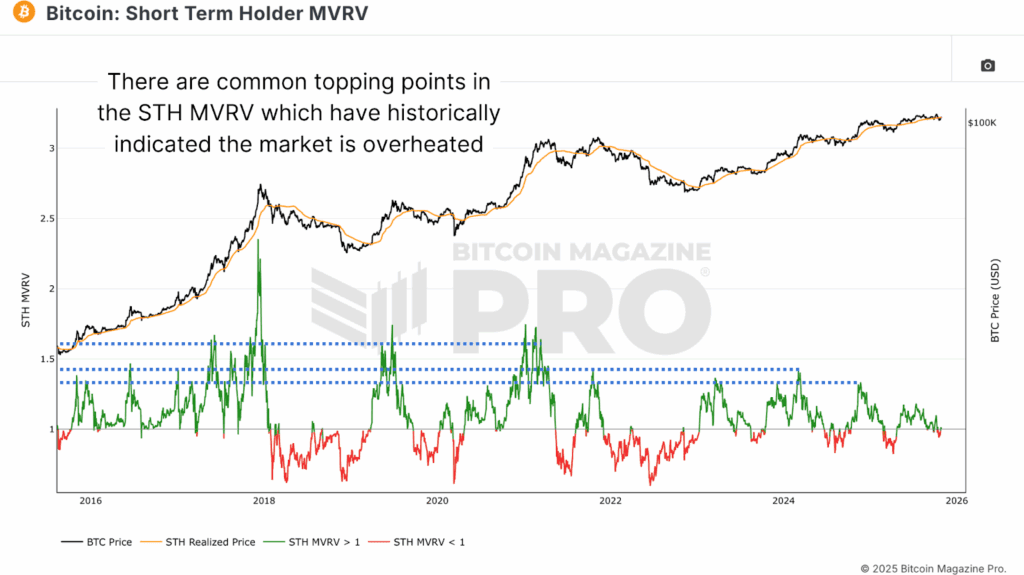
Beyond the realized price itself, we turn to the Short-Term Holder Market Value to Realized Value (MVRV) Ratio, which measures the relationship between Bitcoin’s current market price and its aggregate realized price. This ratio helps identify over- or undervalued conditions.
Across prior cycles, clear patterns emerge, with Bitcoin consistently finding support around the 0.66 level during large down moves, prime zones for accumulation. On the upside, notable resistance has historically appeared around 1.33, 1.43, and 1.64, corresponding to profit-taking points where new participants reach 33%, 43%, or 64% unrealized gains, respectively.
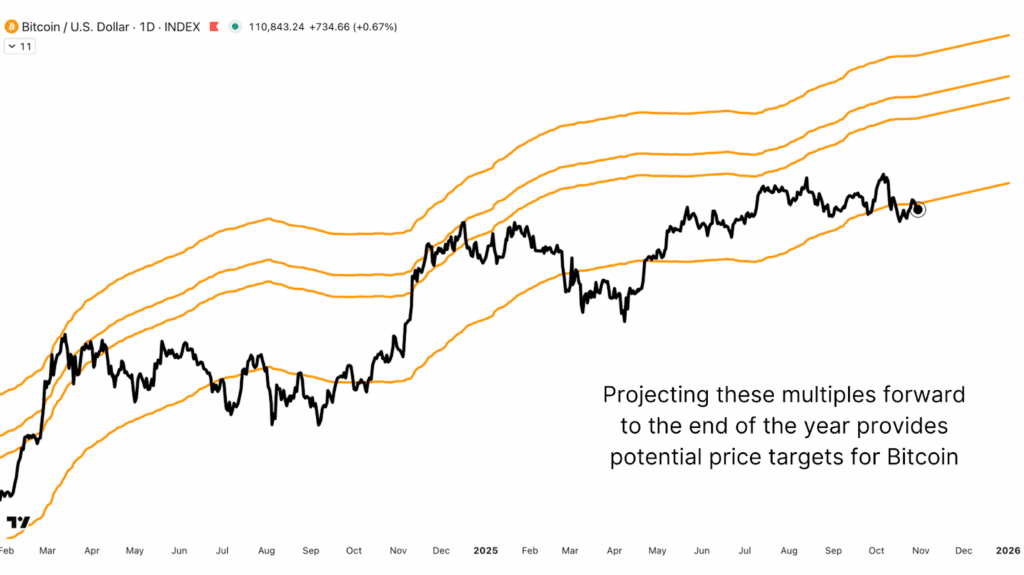
Using these multiples, we can estimate future targets. By multiplying the current STH Realized Price at ~$113,000 by these MVRV thresholds, we can project potential resistance zones for this cycle. The 1.33 zone generates a projected price of approximately $160,000 for the end of the year. The midway 1.43 zone equates to a projection of ~$170,000, and the upper zone of 1.64 extrapolates to around $200,00. These levels align remarkably well with historical resistance zones, suggesting the $160k–$200k range could act as a major price ceiling if Bitcoin continues to hold above its realized base.
Long-Term Holder MVRV and Bitcoin Price Peaks
Next, we turn to the Long-Term Holder MVRV Ratio, which measures unrealized profit and loss among the market’s most experienced investors. This cohort’s behavior provides key insights into macrocycle dynamics. In the 2017 bull run, LTH MVRV peaked at 36.2. In the 2021 cycle, it peaked at 12.58, roughly a 2.9x reduction, demonstrating the diminishing return structure that has defined Bitcoin’s maturation.
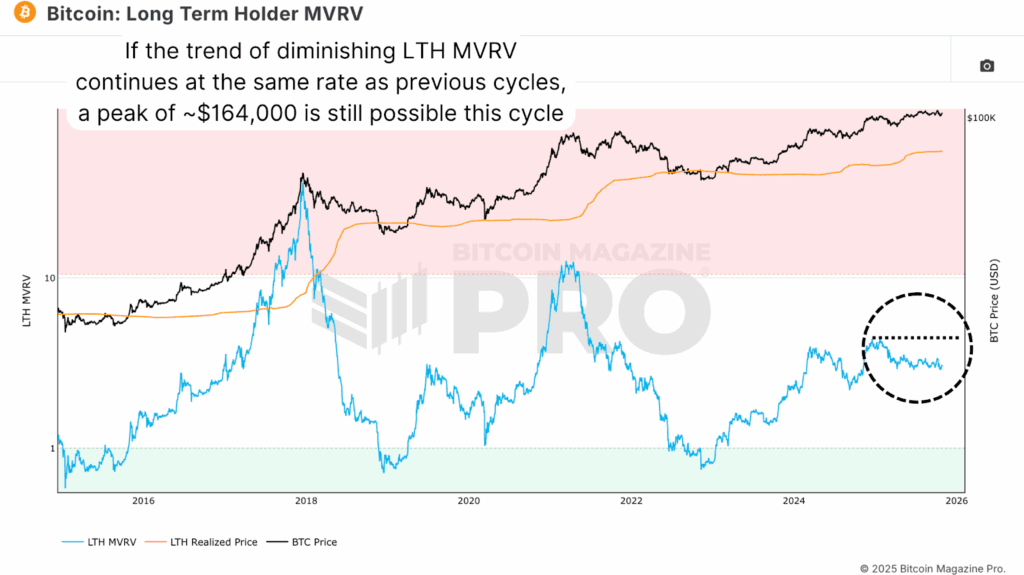
Applying that same diminishing factor (÷2.88) suggests a potential peak around 4.37 for this current cycle. Given that the Long-Term Holder Realized Price sits near $37,400, a 4.37x multiple implies a potential target of roughly $163,000–$165,000, overlapping with the upper targets derived from short-term holder data and levels we’ve already reached this cycle in LTH MVRV terms.
The Rolling MVRV Framework and Bitcoin Price Dynamics
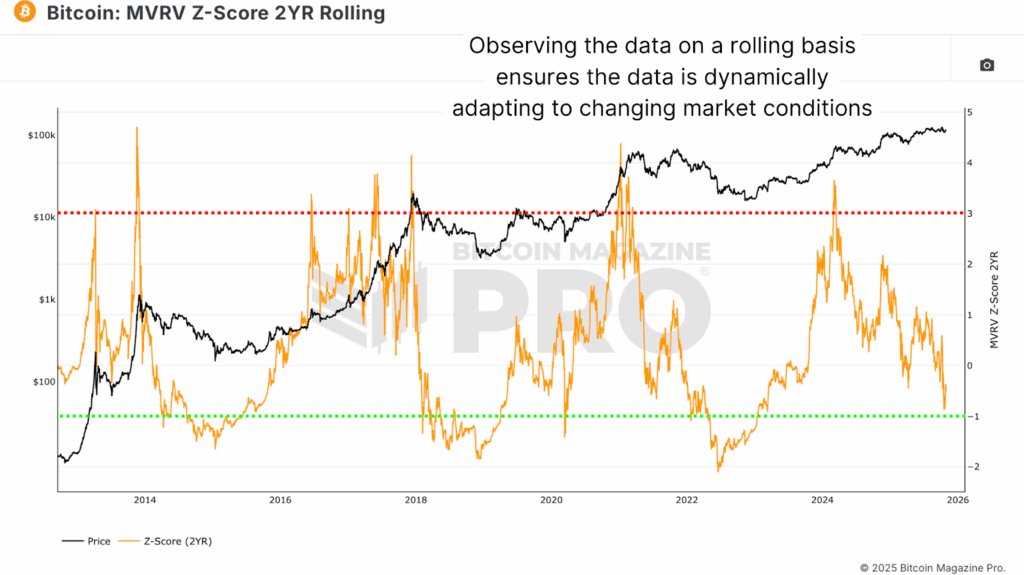
As the Bitcoin market evolves, traditional MVRV metrics must also adapt. One of the most effective approaches is to view these ratios on a rolling basis, which accounts for dynamic changes in market conditions.
When modeled on a 2-Year Rolling basis, the MVRV Z-Score eliminates some of the “diminishing peaks” seen in static models. Peaks around 3.0 and troughs near –1.0 have consistently aligned with market tops and bottoms. Intriguingly, current readings are closer to the buy zone than the sell zone, implying that Bitcoin is still in an accumulation-friendly range.
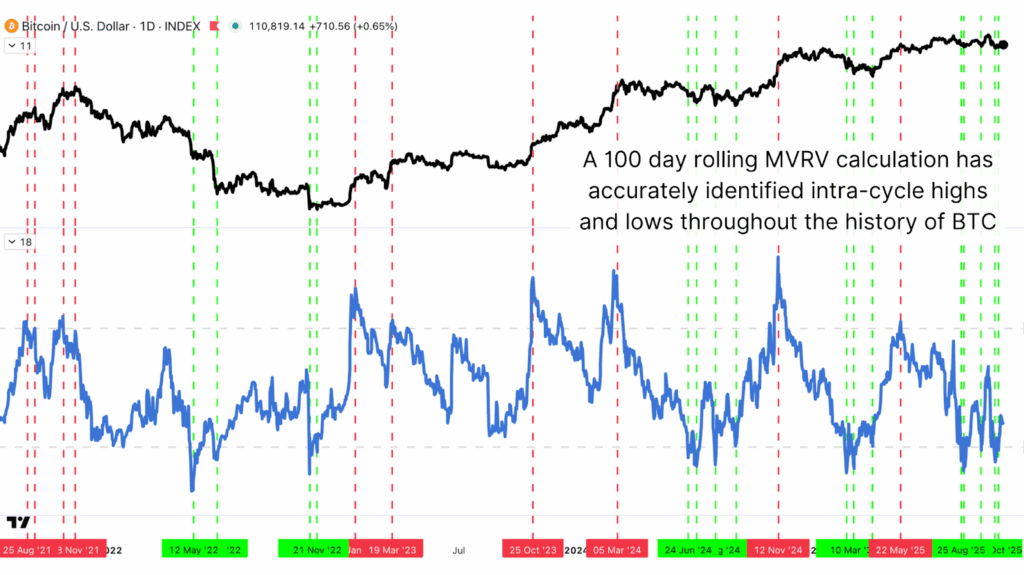
To gain more granularity, we can also assess the MVRV ratio on a 100-day rolling basis, which captures intra-cycle fluctuations. In this model, spikes above +2 correlate with local tops, while dips below –2 align with local bottoms and optimal DCA zones. Across Bitcoin’s entire history, this rolling 100-day MVRV framework has identified some of the most accurate short-term accumulation and distribution points, even within broader cycle trends.
Conclusion
Even as Bitcoin’s market matures and institutional involvement deepens, these core on-chain valuation frameworks remain among the most powerful tools for cycle analysis. The realized price models, particularly those tied to specific cohorts, provide insight into market conviction, showing when participants are in profit and when behavioral shifts are likely to trigger the next move. More importantly, adapting traditional metrics to rolling frameworks ensures our models evolve alongside Bitcoin itself, capturing new investor behavior, liquidity cycles, and the growing institutional influence that defines this market’s future.
If Bitcoin can continue holding above the STH realized price, the data suggests there is ample room to the upside, with plausible cycle targets in the $160,000–$200,000 region.
For a more in-depth look into this topic, watch our most recent YouTube video here: Bitcoin: This On-Chain Data Tells Us Where Price Goes Next
For deeper data, charts, and professional insights into bitcoin price trends, visit BitcoinMagazinePro.com.
Subscribe to Bitcoin Magazine Pro on YouTube for more expert market insights and analysis!
WATCH BITCOIN PRICE VIDEO ANALYSIS 
Disclaimer: This article is for informational purposes only and should not be considered financial advice. Always do your own research before making any investment decisions.