The Bitcoin Magazine Pro Price Forecast Tools chart provides a comprehensive framework for identifying potential price floors during bear cycles and forecasting upside targets based on on-chain fundamentals and network-derived data points. By aggregating multiple metrics, this methodology has historically called Bitcoin market cycle peaks and bottoms with remarkable accuracy. Can these tools continue to provide a basis for reliable BTC price forecasting over the next 12 months and beyond?
Table of Contents
- CVDD & Balanced Price: Bitcoin Price Cycle Low Indicators
- Top Cap, Delta Top, & Terminal Price: Bitcoin Price Cycle Peak Signals
- Bitcoin Cycle Master: Aggregated Bitcoin Price Fair Value Framework
- Projecting Bitcoin Price Forward: 2026 Cycle Scenarios
- Conclusion: What Bitcoin Price Forecast Tools Are Signaling for 2025–2026
CVDD & Balanced Price: Bitcoin Price Cycle Low Indicators
The Cumulative Value Days Destroyed (CVDD) metric has historically called Bitcoin price cycle lows almost to perfection across every cycle since Bitcoin’s inception. This metric begins with Coin Days Destroyed, a measure that weights Bitcoin transfers by the duration they were held before movement. For example, holding 1 Bitcoin for 100 days produces 100 coin days destroyed when transferred, while holding 0.1 Bitcoin for the same result requires 1,000 days of holding. Large spikes indicate that the network’s most experienced long-term holders are transferring significant amounts of Bitcoin.
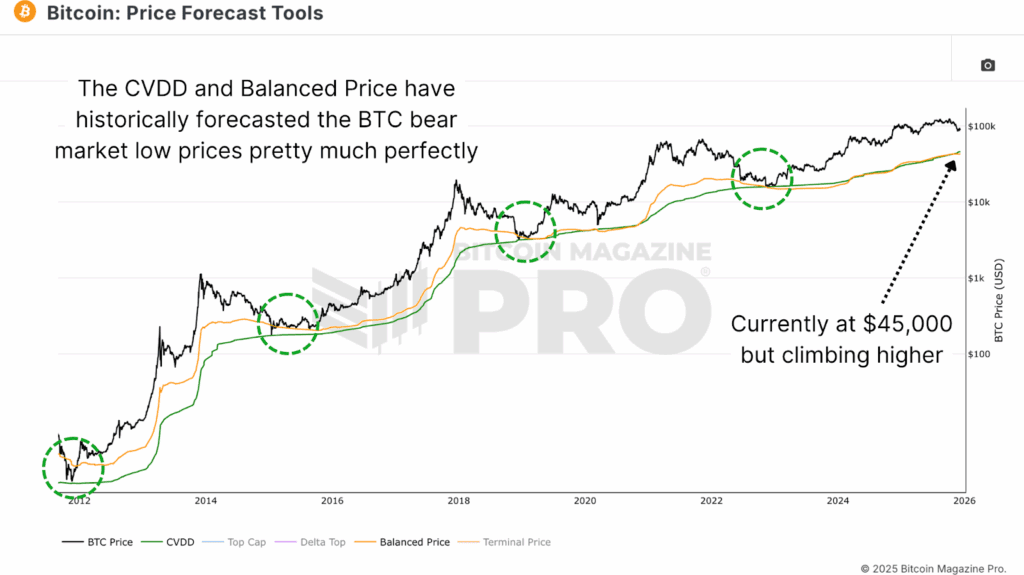
The CVDD takes this one step further by measuring the USD valuation at the time of transfer rather than just the coin days destroyed quantity alone. This value is then multiplied by 6 million to produce the final metric. When examined across Bitcoin’s entire history, the CVDD has indicated bear market lows with accuracy extending across every cycle. Currently, the CVDD sits at approximately $45,000, though this level trends upward over time as the metric naturally evolves with new transfers and Bitcoin’s price appreciation.
The Balanced Price metric complements this downside projection by subtracting the Transferred Price (its calculation methodology is explained later) from the Realized Price, the cost basis or average accumulation price for all bitcoin holders, providing another historically accurate bear cycle low signal.
Top Cap, Delta Top, & Terminal Price: Bitcoin Price Cycle Peak Signals
The Top Cap metric begins with the all-time average cap, the cumulative sum of Bitcoin’s market capitalisation divided by the number of days Bitcoin has existed. This all-time weighted moving average is then multiplied by 35 to produce the Top Cap. Historically, this metric has been remarkably accurate for calling bull market peaks, though in recent cycles it has exceeded actual price action, currently projecting to a seemingly unattainable ~$620,000.
The Delta Top refines this approach by using the realized cap. The realized cap currently stands at approximately $1.1 trillion. Delta Top is calculated by subtracting the average cap from the realized cap and multiplying by 7. This metric has been accurate historically, though it was slightly off during the 2021 cycle, and it is looking more likely that it will not be reached in the current cycle, currently sitting at approximately $270,000.
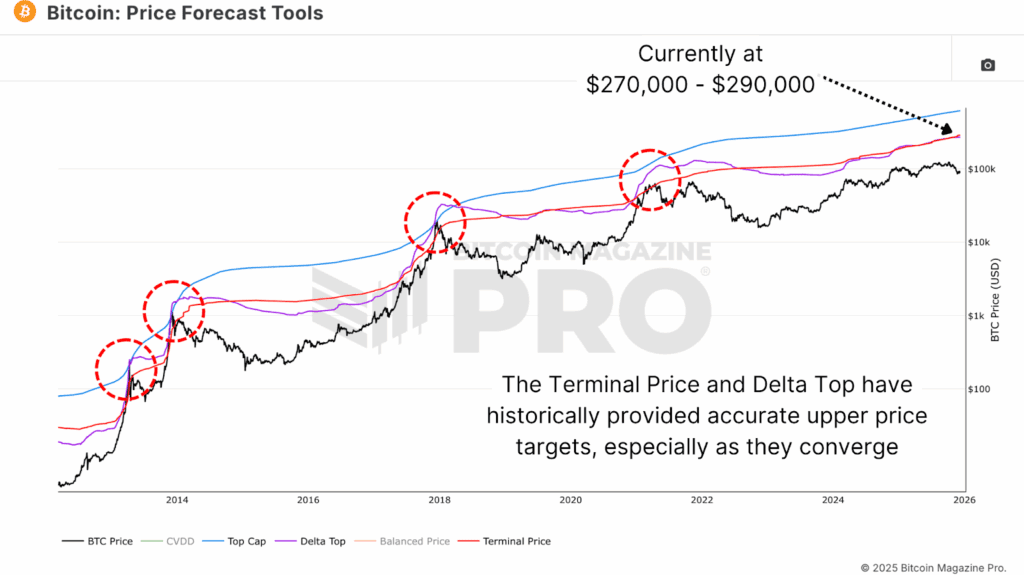
The Terminal Price metric provides another layer of sophistication. It calculates the Transferred Price, the sum of Coin Days Destroyed divided by the Circulating Bitcoin Supply, and multiplies this by 21 (the maximum Bitcoin supply). This produces a price level based on the fundamental assumption of total network value distributed across all 21 million Bitcoins. Historically, the Terminal Price has been one of the most accurate top-calling tools, marking previous cycle peaks nearly to perfection. This metric currently sits at approximately $290,000, not too far above Delta Top’s current value.
Bitcoin Cycle Master: Aggregated Bitcoin Price Fair Value Framework
Integrating all these individual metrics into a unified framework produces the Bitcoin Cycle Master chart, which combines these on-chain forecast tools for confluence. This has helped to identify where Bitcoin may be in a cycle, either close to bull or bear market highs, or oscillating around its ‘Fair Market Value’.
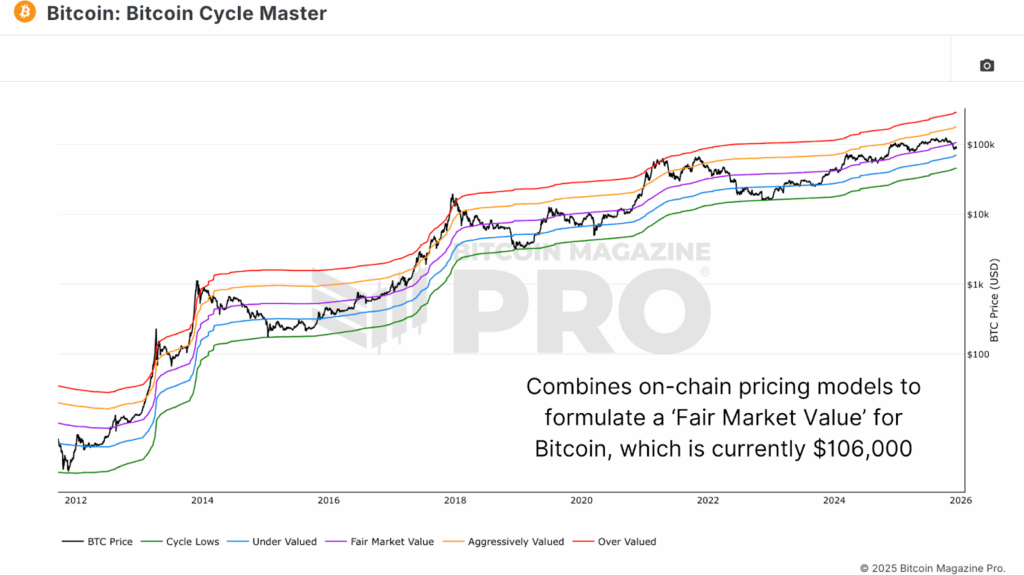
Examining the past two cycles demonstrates the utility of this framework. When Bitcoin trades above the Fair Market Value band, bull markets have historically entered exponential growth phases. When beneath this band, Bitcoin typically signals bear market conditions where defensive positioning and aggressive accumulation become appropriate strategies.
Projecting Bitcoin Price Forward: 2026 Cycle Scenarios
By extracting raw data from the price forecast tools and projecting the slope of both the CVDD and Terminal Price forward to the end of 2026, two scenarios emerge. The CVDD, which has moved at a predictable rate of change over the past 90 days, projects to approximately $80,000 by December 31, 2026. This level could represent a potential bear cycle floor, though Bitcoin has already traded beneath this level during recent downward moves, suggesting current prices may already offer compelling value.
The Terminal Price, extrapolating its current upward trend, could reach over $500,000 by the end of 2026, though this projection could only be a realistic outcome with a bullish macro environment with significant liquidity injections and broad realization of Bitcoin’s fundamental value proposition.
Conclusion: What Bitcoin Price Forecast Tools Are Signaling for 2025–2026
These Bitcoin price forecast tools, formulated using on-chain fundamental and network-derived data points rather than psychological levels or traditional technical analysis applicable to equities and commodities, have historically provided exceptional accuracy in calling market cycle peaks and bottoms. Forecasting based on their current values suggests a potential bear cycle floor in the $80,000 range by the end of 2026, with upside targets potentially reaching over $500,000, depending on macro conditions and capital flows.
While these projections represent extrapolations of current trends rather than certainties, the historical accuracy and on-chain foundation of these metrics warrant serious consideration. Investors and traders should continue monitoring both the raw price forecast tools and the aggregated Bitcoin Cycle Master framework to identify fair valuation levels, extreme overvaluation warnings, and attractive accumulation zones within the current cycle. However, all projections change daily as new data emerges, making reactive analysis superior to long-term prediction.
For a more in-depth look into this topic, watch our most recent YouTube video here: Bitcoin: Using On-Chain Data To Value & Predict The Price
For deeper data, charts, and professional insights into bitcoin price trends, visit BitcoinMagazinePro.com. Subscribe to Bitcoin Magazine Pro on YouTube for more expert market insights and analysis!
WATCH BITCOIN PRICE VIDEO ANALYSIS
Disclaimer: This article is for informational purposes only and should not be considered financial advice. Always do your own research before making any investment decisions.