
This is an opinion editorial by Shane Neagle, the editor-in-chief of “The Tokenist.”
Macroeconomic headwinds are continuously adding to a bearish narrative across all markets, including bitcoin.
As of October 2022, bitcoin is down more than 60% since the start of the year, yet bitcoin’s trading volume remains fairly consistent since July 2022. Does that mean the majority of holders are giving up on the prospect of bitcoin and opting to sell?
This is a complex topic to dive into, but there’s one indicator that can help us paint a picture of what’s taking place behind the noise: coin days destroyed (CDD).
What Are Coin Days Destroyed?
Throughout the course of an asset’s trading history, there is a significant difference if the buying price was on the lower or higher end of the price spectrum. In the case of bitcoin, that spectrum is relatively short — just 13 years — but quite variable in terms of price (ranging from $0-$69,000). The original cryptocurrency has undergone four major bull and bear cycles, but when zooming out, has continuously trended upwards.
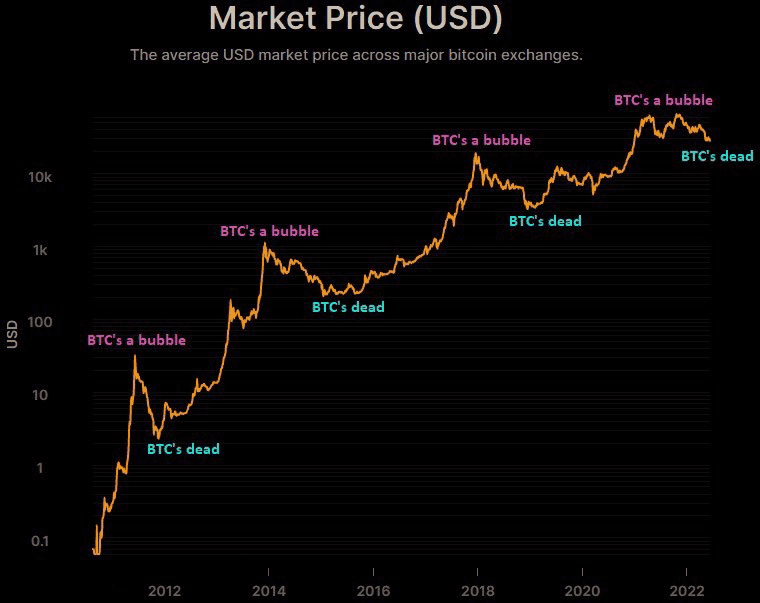
The implication of this long-term, upward trajectory is clear. Investors who were the earliest to buy bitcoin have the most to gain by selling, even in bear markets. Likewise, investors who took the opportunity to purchase bitcoin early and at a lower cost, had the opportunity to buy much more bitcoin for the same amount of fiat currency compared to prices later in bitcoin’s history.
In turn, bitcoin that were mined and purchased earlier have different value significance than newer bitcoin released into the circulating supply. If these “aged” bitcoin are held in the same wallet for an extended period of time, such on-chain activity would suggest a strong conviction held by the owner in terms of bitcoin’s long-term value proposition. Such activity sends a strong signal to the Bitcoin network.
In addition, a long-term holder of dormant bitcoin has an increased likelihood of experiencing multiple bear and bull market cycles, which further amplifies the significance of old bitcoin moving.
The metric of coin days destroyed measures this significance. According to Glassnode, “Coin days destroyed is a measure of economic activity which gives more weight to coins which haven’t been spent for a long time.” CDD is calculated by multiplying the number of coins in a given transaction by the number of days since they last moved from a wallet.
Bitcoin is often critiqued for its high levels of volatility. Yet there’s clear demand for bitcoin in long-term investments, even in traditional IRAs. CDD is a popular on-chain indicator used to measure the sentiment maintained by long-term holders — individuals who see value in the long-term prospects of bitcoin.
So, what does the current CDD level suggest?
Bitcoin’s CDD Has Been Quite Low
At 0.36, the 90-day moving average of bitcoin’s CDD in October 2022 hit one of the lowest values throughout its history. This particular range was only visited previously in 2018, 2015 and late 2011. As the supply-adjusted bitcoin days destroyed (BDD) chart below shows, the highest BDD upticks happened during bull run peaks, which is to be expected as long-term holders lock in their profits.
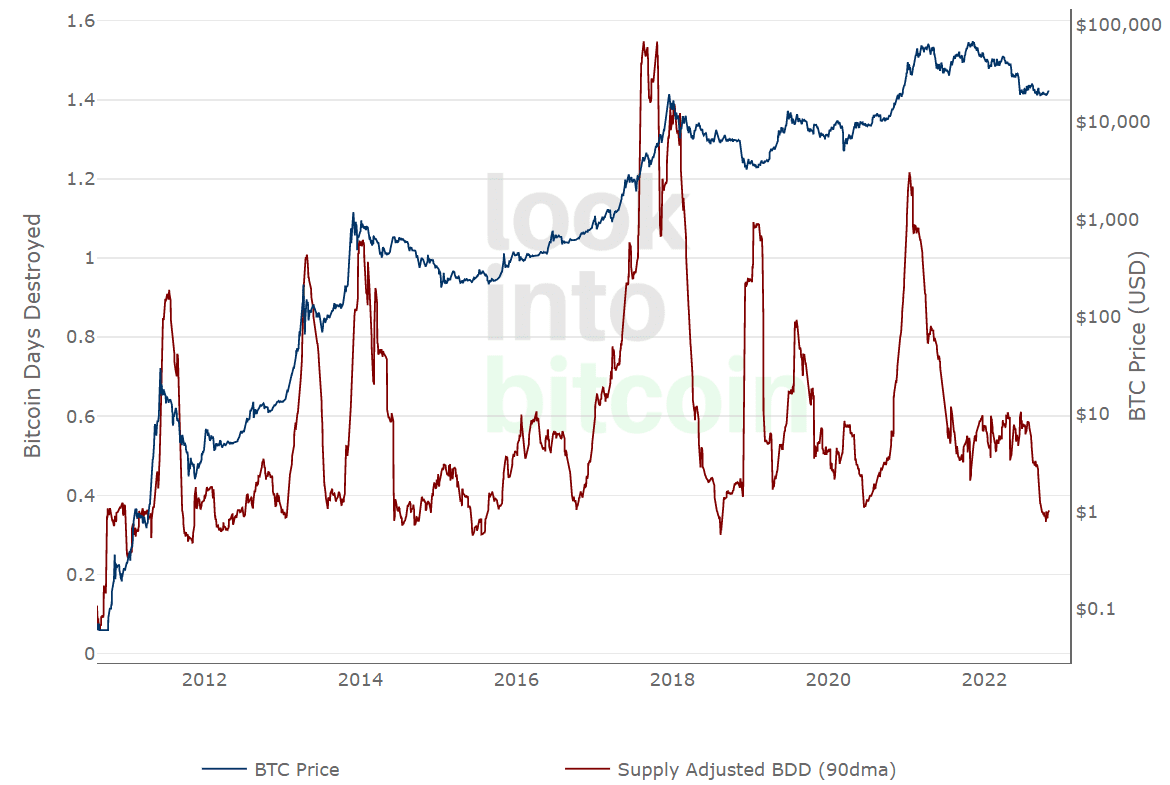
In other words, long-term Bitcoiners — in the context of the asset’s historical selling activity — are continuing to hold bitcoin in large numbers. This could be one of the reasons why bitcoin’s price activity has been relatively stable. Such holders could be acting as safeguards against selling pressure.
If we turn to bitcoin’s trading volume, do we see a similar pattern?
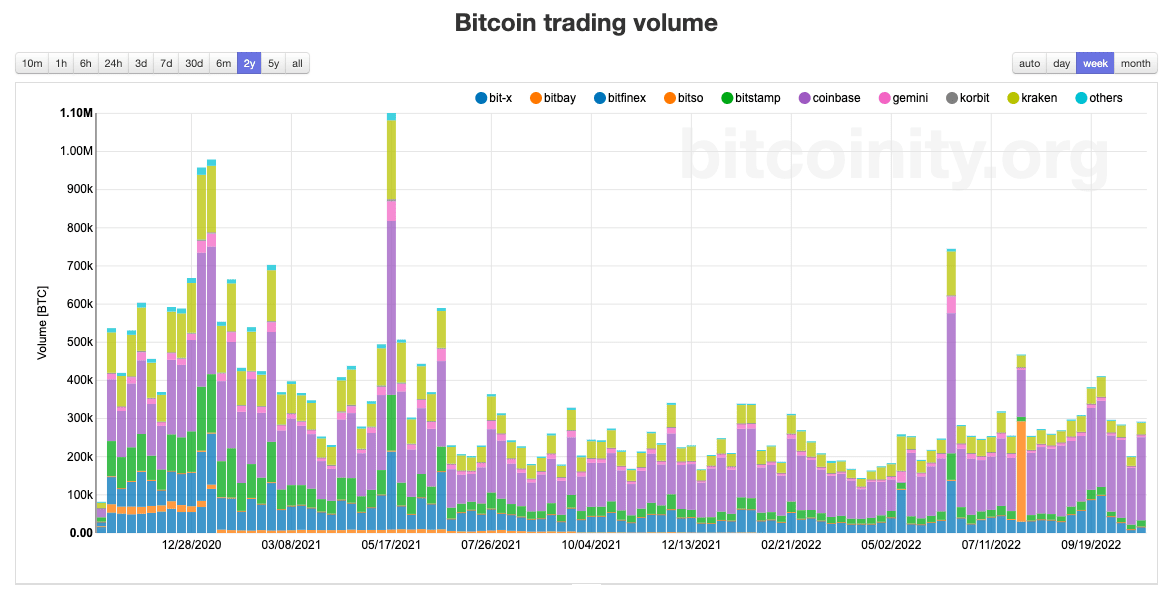
The above chart shows bitcoin’s trading volume from October 2020 to October 2022. What’s noted here is fairly steady and consistent trading volume from roughly July 2021 to October 2022. We do not see a drop, which resembles the activity from CDD.
The combination of data from these two indicators — a low CDD with steady and consistent trading volume — further suggests that most of the bitcoin traded was by short-term holders. In fact, bitcoin from 2010/2011, purchased at well under the $100 range, have moved the least.
Overall, according to Glassnode data, just over 60% of circulating BTC haven’t moved in over a year. This holding trend also contributed to bitcoin’s exceptionally low volatility. Comparatively, in 2018, a similar price volatility was followed by a 50% drop in a single month, from $6,408 in November to $3,193 in December.
Is it likely we will see a new bottom even with long-term Bitcoiners holding the line?
Additional Bitcoin Sell-Off Pressures
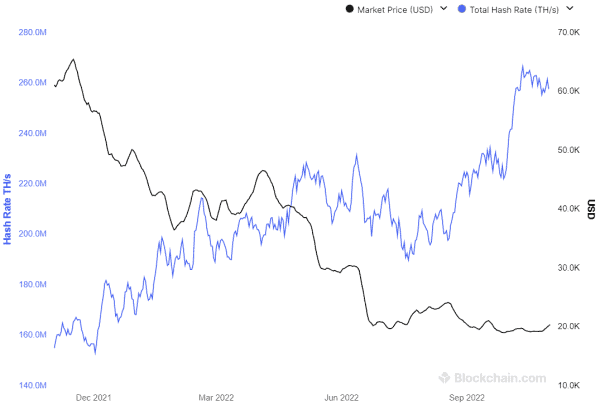
Presently, bitcoin’s price is inversely related to its record-high hash rate. This is not good news considering miners have to service their debts by selling mined bitcoin, even at their bottom price point in this bear cycle.
Already, one of the largest bitcoin mining companies, Core Scientific (CORZ) — with a share of hash rate around 5% of the network’s total — is exploring bankruptcy. In the meantime, CORZ stock collapsed by 98.32% year-to-date.
Argo Blockchain (ARBK) shares the same fate, having fallen by 91.56% and is unable to sell enough assets to cover the costs. According to an operational update from Argo in October 2022:
“Should Argo be unsuccessful in completing any further financing, Argo would become cash flow negative in the near term and would need to curtail or cease operations.”
Although these mining companies will likely end up lowering the Bitcoin hash difficulty, in a game of survival of the fittest this has the potential to cause another contagion spiral. This time around, vulnerability and market sell-offs could come from remaining centralized platforms that are lending dollars to bitcoin mining companies. Going back to the ongoing macroeconomic headwinds, how the market interprets the Federal Reserve’s next moves may end up raising the price of bitcoin just enough for miners to stay above water.
Because the Fed increases the cost of capital and borrowing, making the dollar stronger in the process, this typically makes investors leave risk-on assets, such as bitcoin. When investors forecast a recession, the dollar reigns even stronger, as investors dive into cash as a safe harbor.
By the same token, the Fed’s signaling against accelerated tightening — a pivot from its anticipated raise schedule — could provide market relief.
With that said, the so-called “Fed pivot” should not be understood as a return to lower interest rates, but as a deceleration to potentially hiking only 50 basis points in December (if incoming inflation data favors it). Nonetheless, in the current fearful market environment, that may be sufficient for a short-term rally, or at least, the avoidance of a new bitcoin bottom.
Despite the many factors pushing investors away from risk-on assets — the Fed battling 40-year-high inflation, a looming energy crisis in Europe, ongoing global supply chain issues and even Bitcoin’s mining difficulty — data from CDD and bitcoin trading volume provides us with an interesting observation. Long-term holders seem more confident than ever in the long-term value proposition that bitcoin provides. Such holders are currently selling bitcoin at one of the lowest rates we’ve seen in the history of the Bitcoin network.
This is a guest post by Shane Neagle. Opinions expressed are entirely their own and do not necessarily reflect those of BTC Inc or Bitcoin Magazine.