While many are still focused on how high the bitcoin price could go during this current bull market (although given current price action, maybe not!), it’s equally important to prepare for what comes next. Here we’ll look at the data and mathematics that can help us estimate where Bitcoin’s next bear market low could occur — not as a prediction, but as a framework based on prior cycles, on-chain valuation metrics, and even the fundamental valuations of BTC.
Table of Contents
- Cycle Master: Modeling Historical Bitcoin Price Bottoms
- Diminishing Drawdowns: Why Each Bitcoin Price Bear Market Hurts Less
- Forecasting the Next Bitcoin Price Top and Bottom
- Bitcoin Price and the Rising Cost of Production
- Conclusion: The Next Bitcoin Price Cycle Will Likely Be Shallower
Cycle Master: Modeling Historical Bitcoin Price Bottoms
One of the most consistently accurate models for identifying Bitcoin’s cyclical bottoms is what we refer to as the Bitcoin Cycle Master chart, which collates a number of on-chain metrics to create bands around price with certain valuation levels.
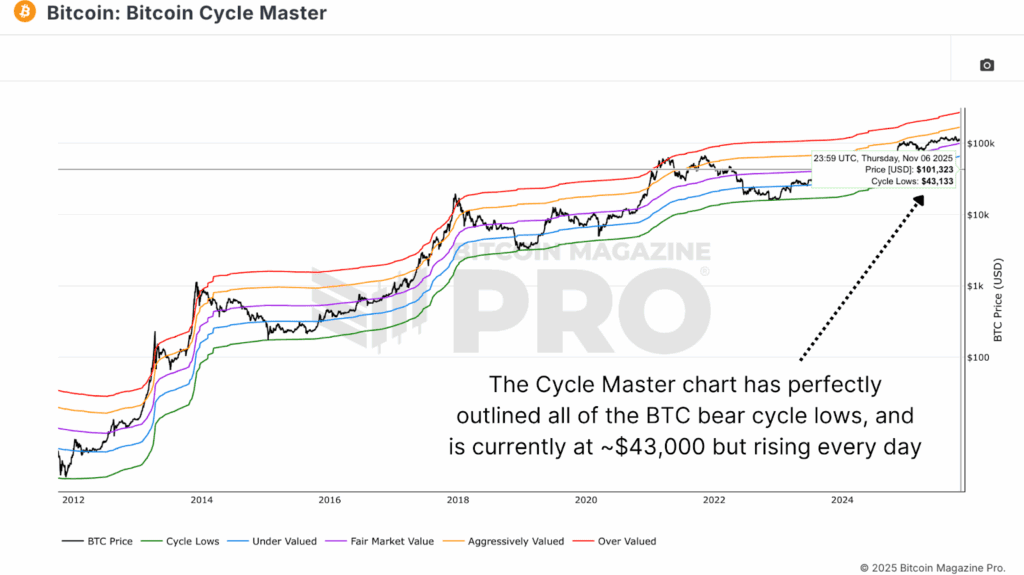
Historically, this green “Cycle Lows” line has pinpointed Bitcoin’s macro bottoms with near perfection. From $160 in 2015 to $3,200 in 2018, and again at $15,500 in late 2022. As of today, this band sits around $43,000 and rising daily, which provides a useful baseline to estimate how far Bitcoin could decline in the next full cycle.
Diminishing Drawdowns: Why Each Bitcoin Price Bear Market Hurts Less
Alongside this, we can look at the raw MVRV Ratio, which measures Bitcoin’s market price versus its realized price (the average cost basis of all coins). Historically, during deep bear markets, Bitcoin tends to fall to 0.75x of its realized price, meaning the market price trades about 25% below the network’s aggregate cost basis.
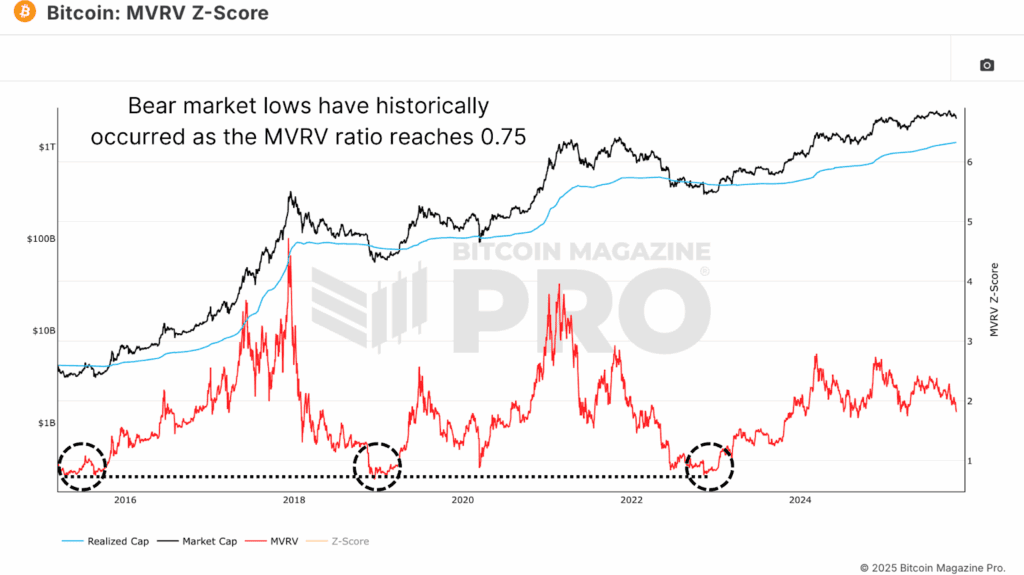
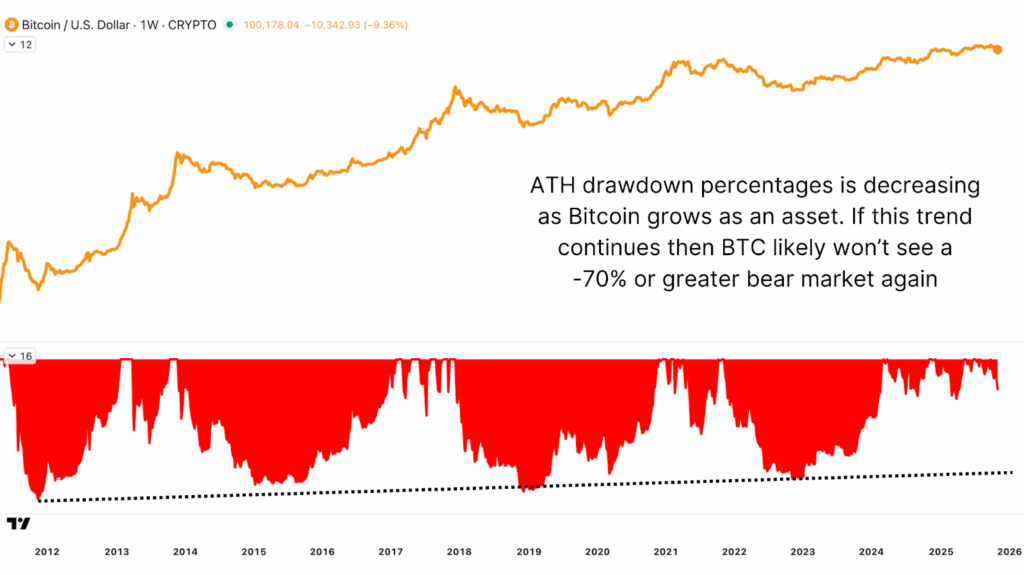
This repeatability gives us a powerful anchor for estimating potential downside when combined with the trend of diminishing drawdowns. While Bitcoin’s earliest cycles saw declines as deep as 88%, that figure has been steadily compressing, to 80% in 2018 and 75% in 2022. Projecting that same trend forward, a continuation of diminishing volatility would imply that the next bear market could bring a ~70% retracement from cycle highs.
Forecasting the Next Bitcoin Price Top and Bottom
Before we estimate the next low, we need a reasonable assumption for where this bull market could peak. Based on historical MVRV multiples and slope-trended realized price growth, Bitcoin has recently tended to top at roughly 2.5x its realized price. If that relationship holds and the realized price continues trending upward, it suggests a potential top somewhere near $180,000 per BTC in late 2025.
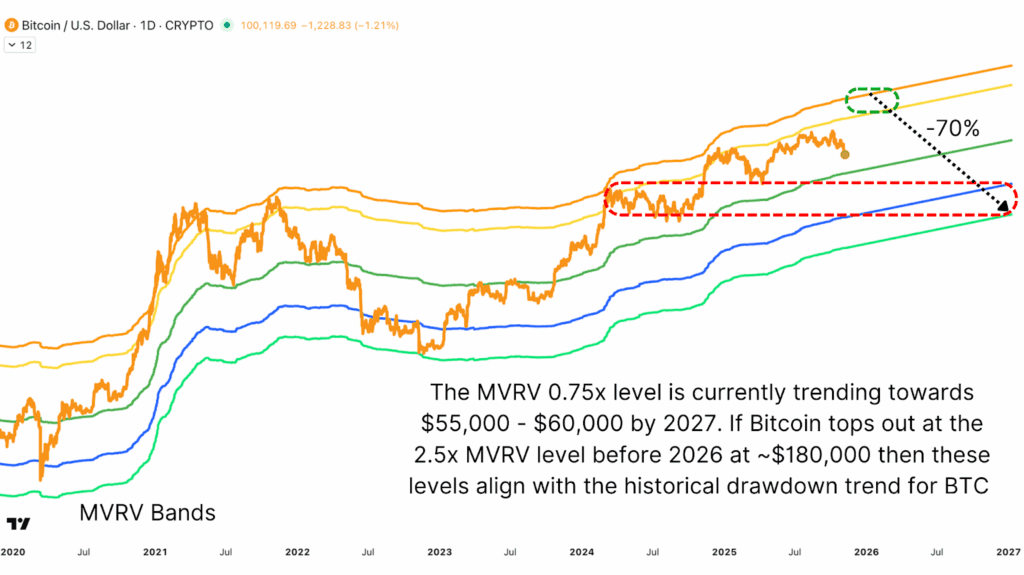
If that’s the case, and Bitcoin were to follow its historical one-year bear market lag into 2027, a 70% retracement from that level would bring the next major cycle low to approximately $55,000–$60,000, based on the current realized price trajectory at that time. These prices also align nicely with Bitcoin’s choppy consolidation range from last year to give some technical confluence.
Bitcoin Price and the Rising Cost of Production
One of the most reliable long-term valuation metrics for Bitcoin is its production cost, the estimated electrical expense to mine one BTC. This metric has historically aligned closely with Bitcoin’s deepest bear market lows. After every halving, the production cost doubles, forming a rising structural floor under the price over time.
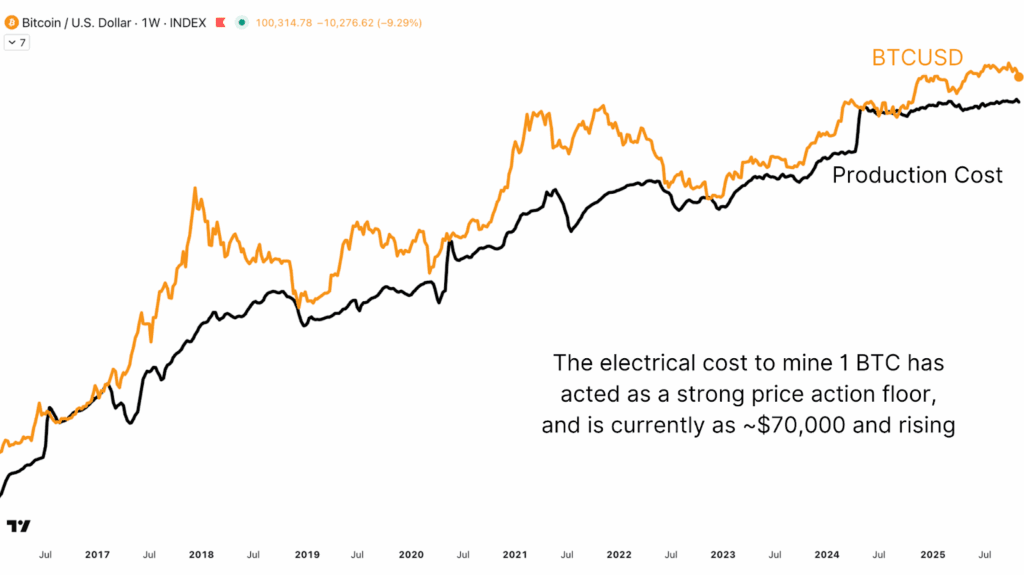
When Bitcoin trades below its production cost, it signals miner stress and typically coincides with generational accumulation opportunities. As of the April 2024 halving, the new cost basis rose sharply, and each time Bitcoin has dipped near or slightly below it since, it has marked local bottoms and subsequent sharp reversals. This value currently sits at ~$70,000 but fluctuates daily.
Conclusion: The Next Bitcoin Price Cycle Will Likely Be Shallower
Every Bitcoin cycle has been accompanied by a wave of euphoria claiming, “This time is different.” But the data continues to show otherwise. While institutional adoption and broader financial integration have indeed changed Bitcoin’s structure, they haven’t erased its cyclicality.
The data suggests the next bear market will likely be shallower, reflecting a more mature and liquidity-driven environment. A retracement toward the $55,000–$70,000 zone would not signal collapse, but it would mark the continuation of Bitcoin’s historical rhythm of expansion and reset.
For a more in-depth look into this topic, watch our most recent YouTube video here: Using Math & Data To Predict The Bitcoin Bear Market Low
For deeper data, charts, and professional insights into bitcoin price trends, visit BitcoinMagazinePro.com.
Subscribe to Bitcoin Magazine Pro on YouTube for more expert market insights and analysis!
WATCH BITCOIN PRICE VIDEO ANALYSIS 
Disclaimer: This article is for informational purposes only and should not be considered financial advice. Always do your own research before making any investment decisions.