
Bitcoin’s 2025 journey hasn’t delivered the explosive bull market surge many expected. After peaking above $100,000, the 2025 Bitcoin price retraced sharply to as low as $75,000, sparking debate among investors and analysts about where we stand in the Bitcoin cycle. In this analysis, we cut through the noise, leveraging on-chain indicators and macro data to determine if the Bitcoin bull market remains intact or if a deeper Bitcoin correction looms in Q3 2025. Key metrics like MVRV Z-Score, Value Days Destroyed (VDD), and Bitcoin capital flows provide critical insights into the market’s next move.
Is Bitcoin’s 2025 Pullback Healthy or Bull Cycle End?
A strong starting point for assessing the 2025 Bitcoin cycle is the MVRV Z-Score, a trusted on-chain indicator that compares market value to realized value. After hitting 3.36 at Bitcoin’s $100,000 peak, the MVRV Z-Score dropped to 1.43, aligning with the 2025 Bitcoin price decline from $100,000 to $75,000. This 30% Bitcoin correction may seem alarming, but recent data shows the MVRV Z-Score rebounding from its 2025 low of 1.43.
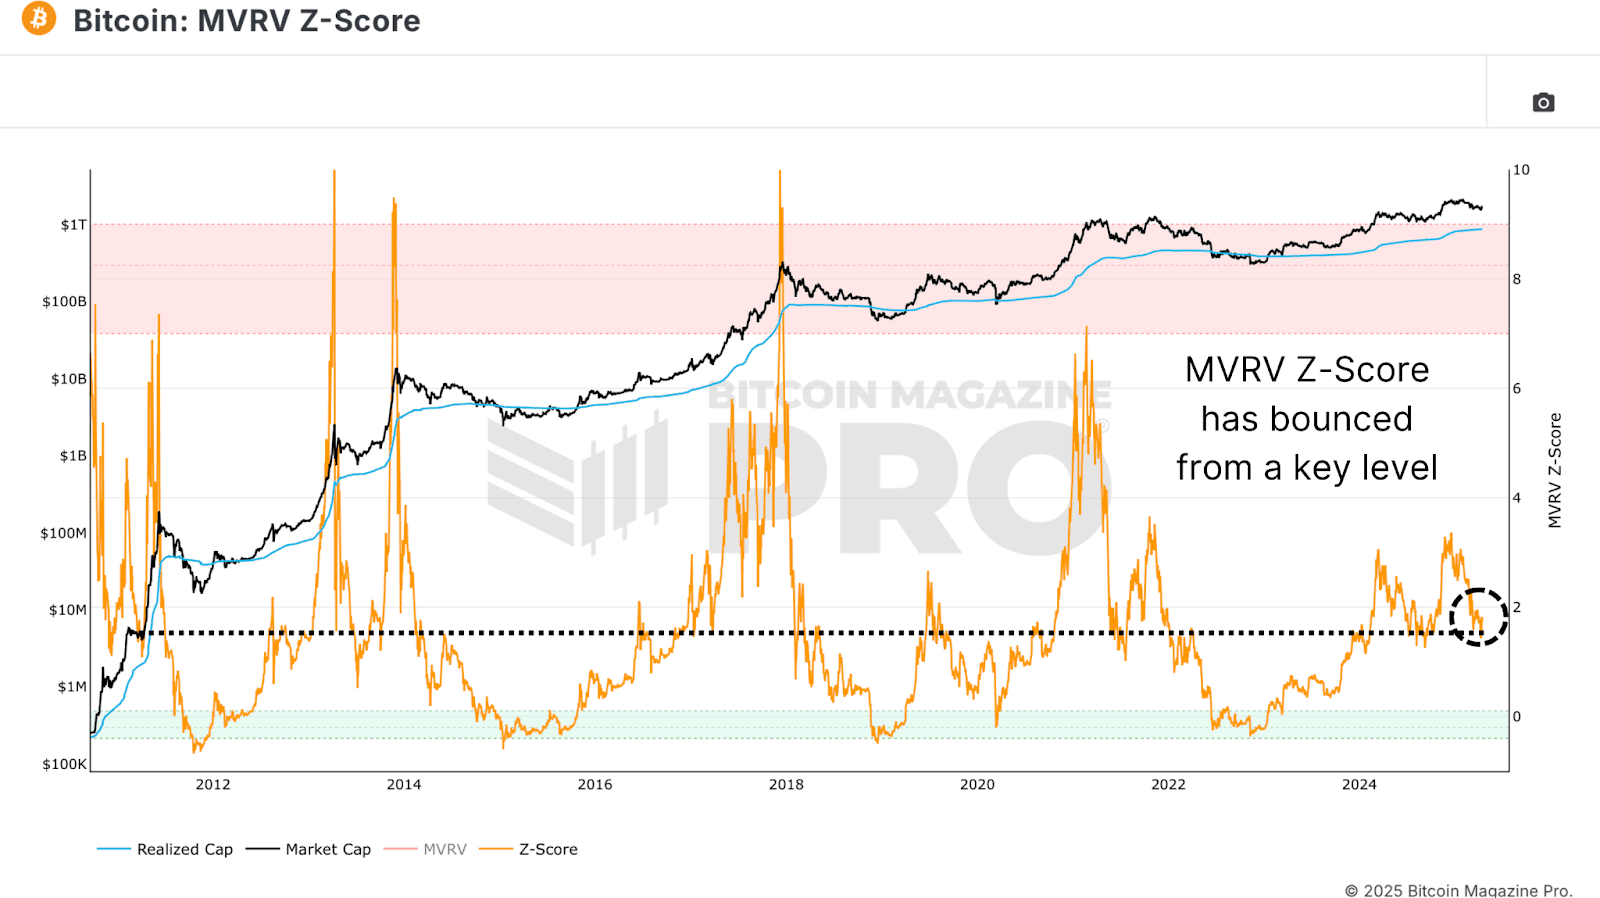
Historically, MVRV Z-Score levels around 1.43 have marked local bottoms, not tops, in prior Bitcoin bull markets (e.g., 2017 and 2021). These Bitcoin pullbacks often preceded resumed uptrends, suggesting the current correction aligns with healthy bull cycle dynamics. While investor confidence is shaken, this move fits historical patterns of Bitcoin market cycles.
How Smart Money Shapes the 2025 Bitcoin Bull Market
The Value Days Destroyed (VDD) Multiple, another critical on-chain indicator, tracks the velocity of BTC transactions weighted by holding periods. Spikes in VDD signal profit-taking by experienced holders, while low levels indicate Bitcoin accumulation. Currently, VDD is in the “green zone,” mirroring levels seen in late bear markets or early bull market recoveries.
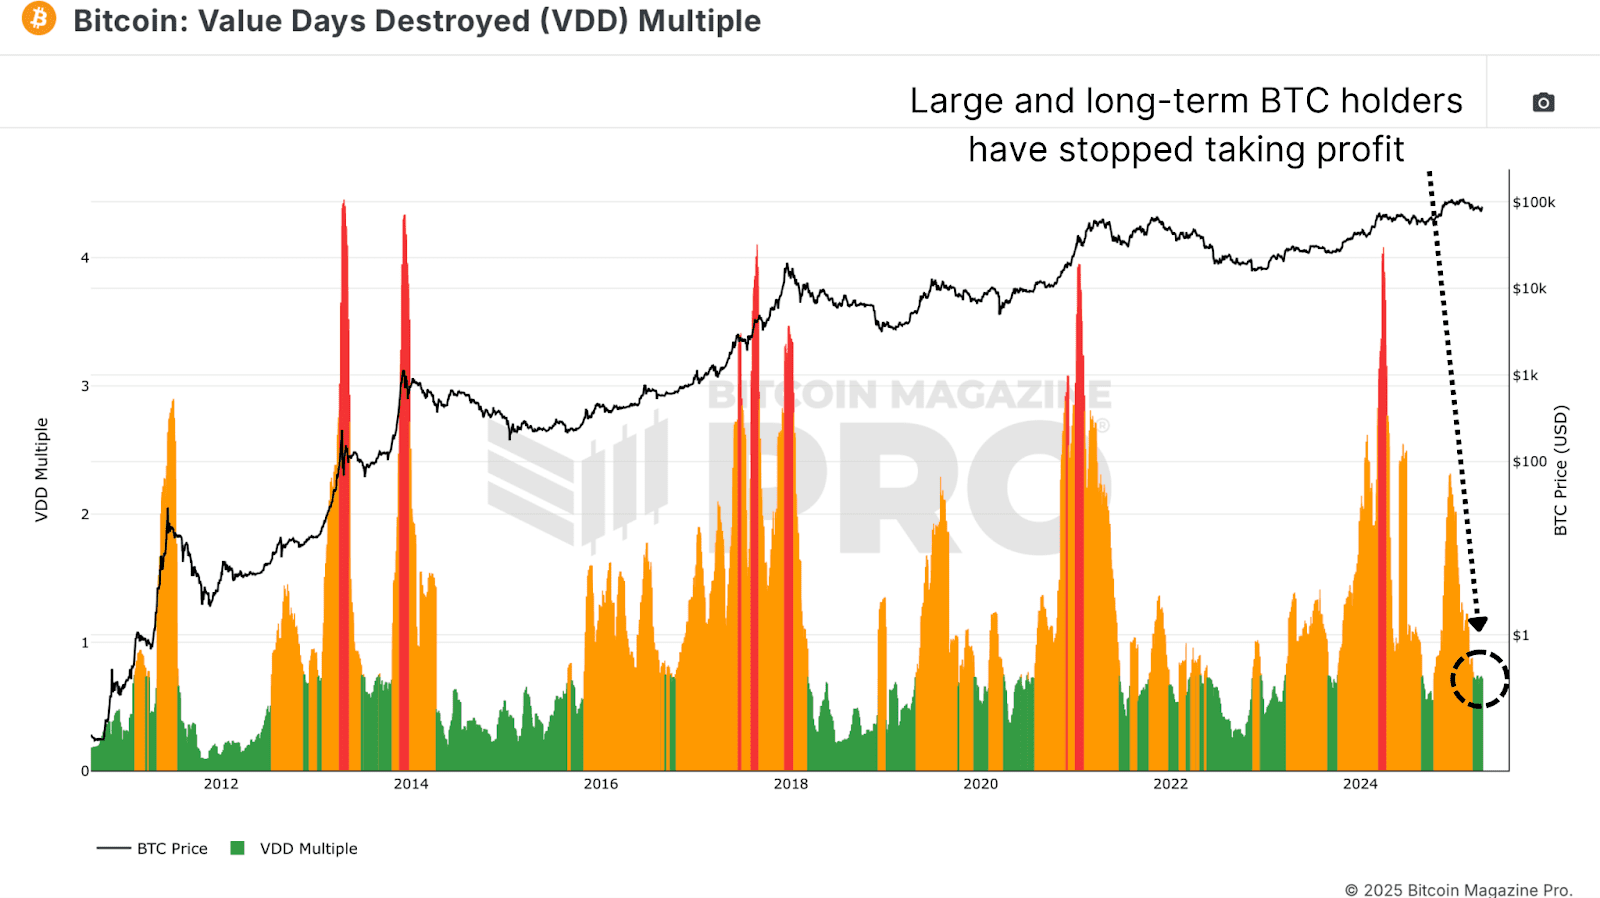
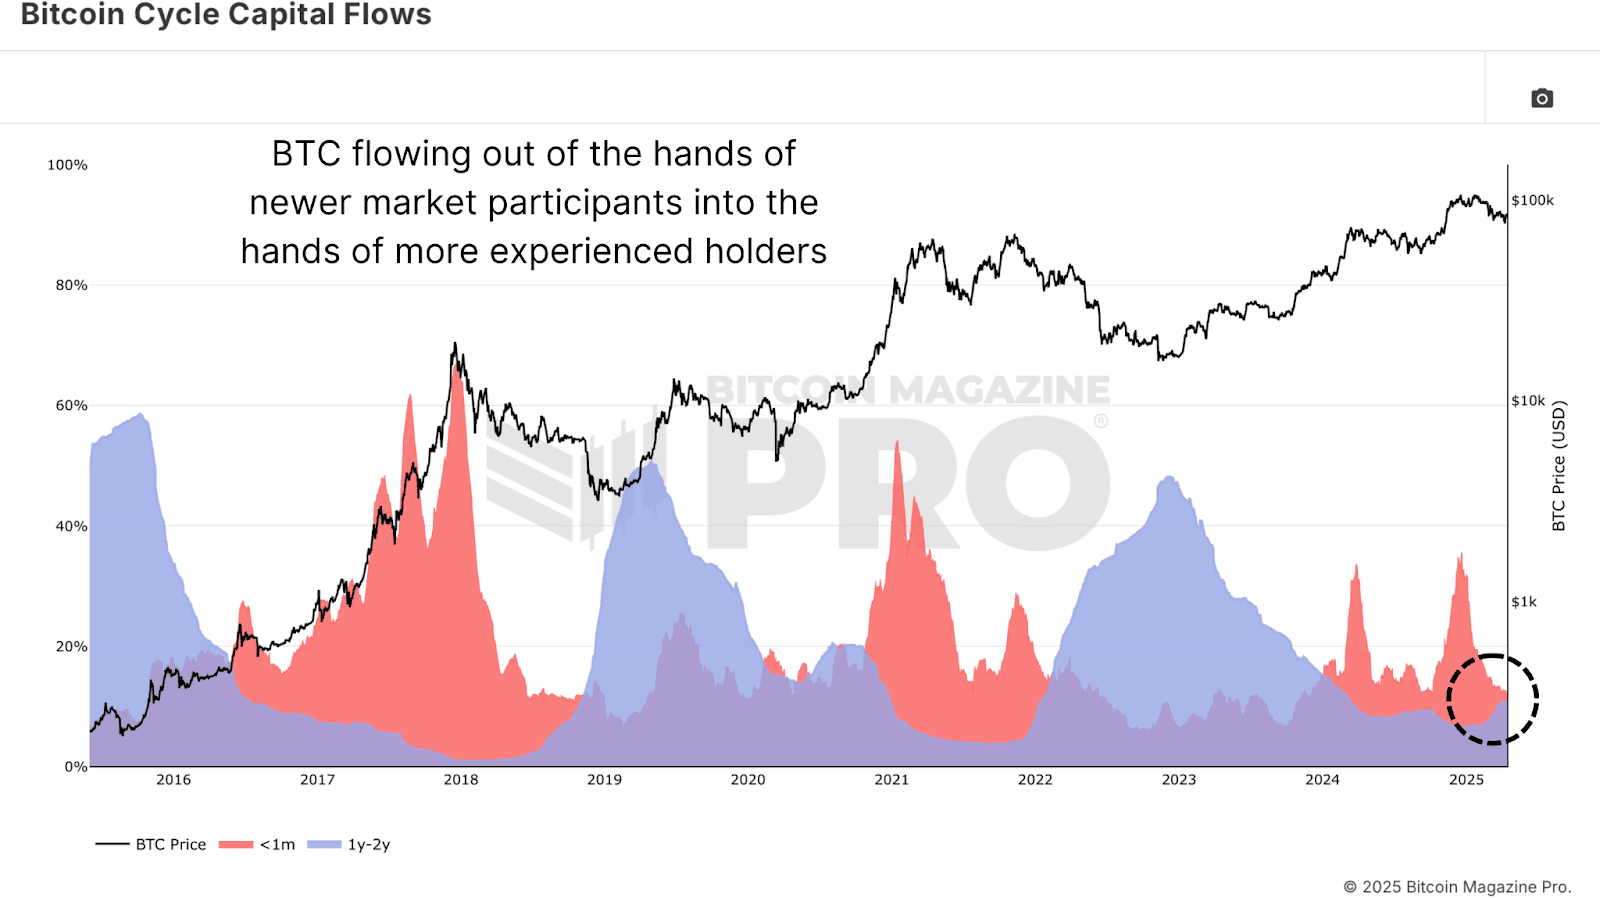
Following Bitcoin’s reversal from $100,000, the low VDD suggests the end of a profit-taking phase, with long-term holders accumulating in anticipation of higher 2025 Bitcoin prices. The Bitcoin Cycle Capital Flows chart further illuminates this trend, breaking down realized capital by coin age. Near the $106,000 peak, new market entrants (<1 month) drove a spike in activity, signaling FOMO-driven buying. Since the Bitcoin pullback, this group’s activity has cooled to levels typical of early-to-mid bull markets.
In contrast, the 1–2 year cohort—often macro-savvy Bitcoin investors—is increasing activity, accumulating at lower prices. This shift mirrors Bitcoin accumulation patterns from 2020 and 2021, where long-term holders bought during dips, setting the stage for bull cycle rallies.
Where Are We in the 2025 Bitcoin Market Cycle?
Zooming out, the Bitcoin market cycle can be divided into three phases:
- Bear phase: Deep Bitcoin corrections of 70–90%.
- Recovery phase: Reclaiming prior all-time highs.
- Bull/exponential phase: Parabolic Bitcoin price advances.
Past bear markets (2015, 2018) lasted 13–14 months, and the most recent Bitcoin bear market followed suit at 14 months. Recovery phases typically span 23–26 months, and the current 2025 Bitcoin cycle falls within this range. However, unlike past bull markets, Bitcoin’s breakout above previous highs was followed by a pullback rather than an immediate surge.
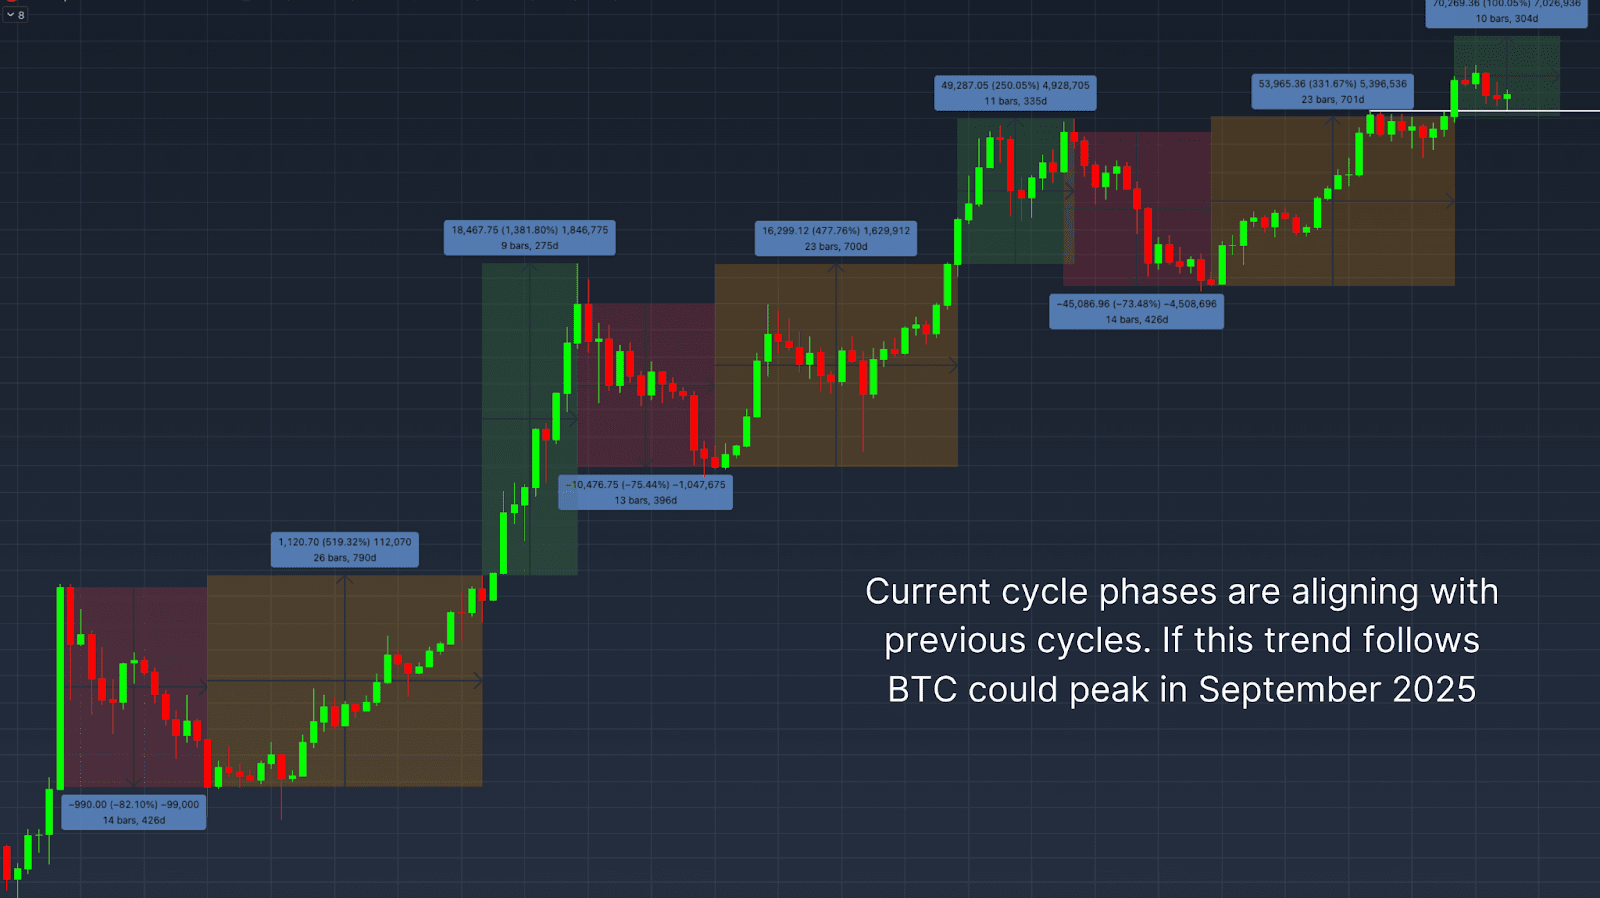
This Bitcoin pullback may signal a higher low, setting up the exponential phase of the 2025 bull market. Based on past cycles’ 9–11-month exponential phases, the Bitcoin price could peak around September 2025, assuming the bull cycle resumes.
Macro Risks Impacting Bitcoin Price in Q3 2025
Despite bullish on-chain indicators, macro headwinds pose risks to the 2025 Bitcoin price. The S&P 500 vs. Bitcoin Correlation chart shows Bitcoin remains tightly linked to U.S. equities. With fears of a global recession growing, weakness in traditional markets could cap Bitcoin’s near-term rally potential.
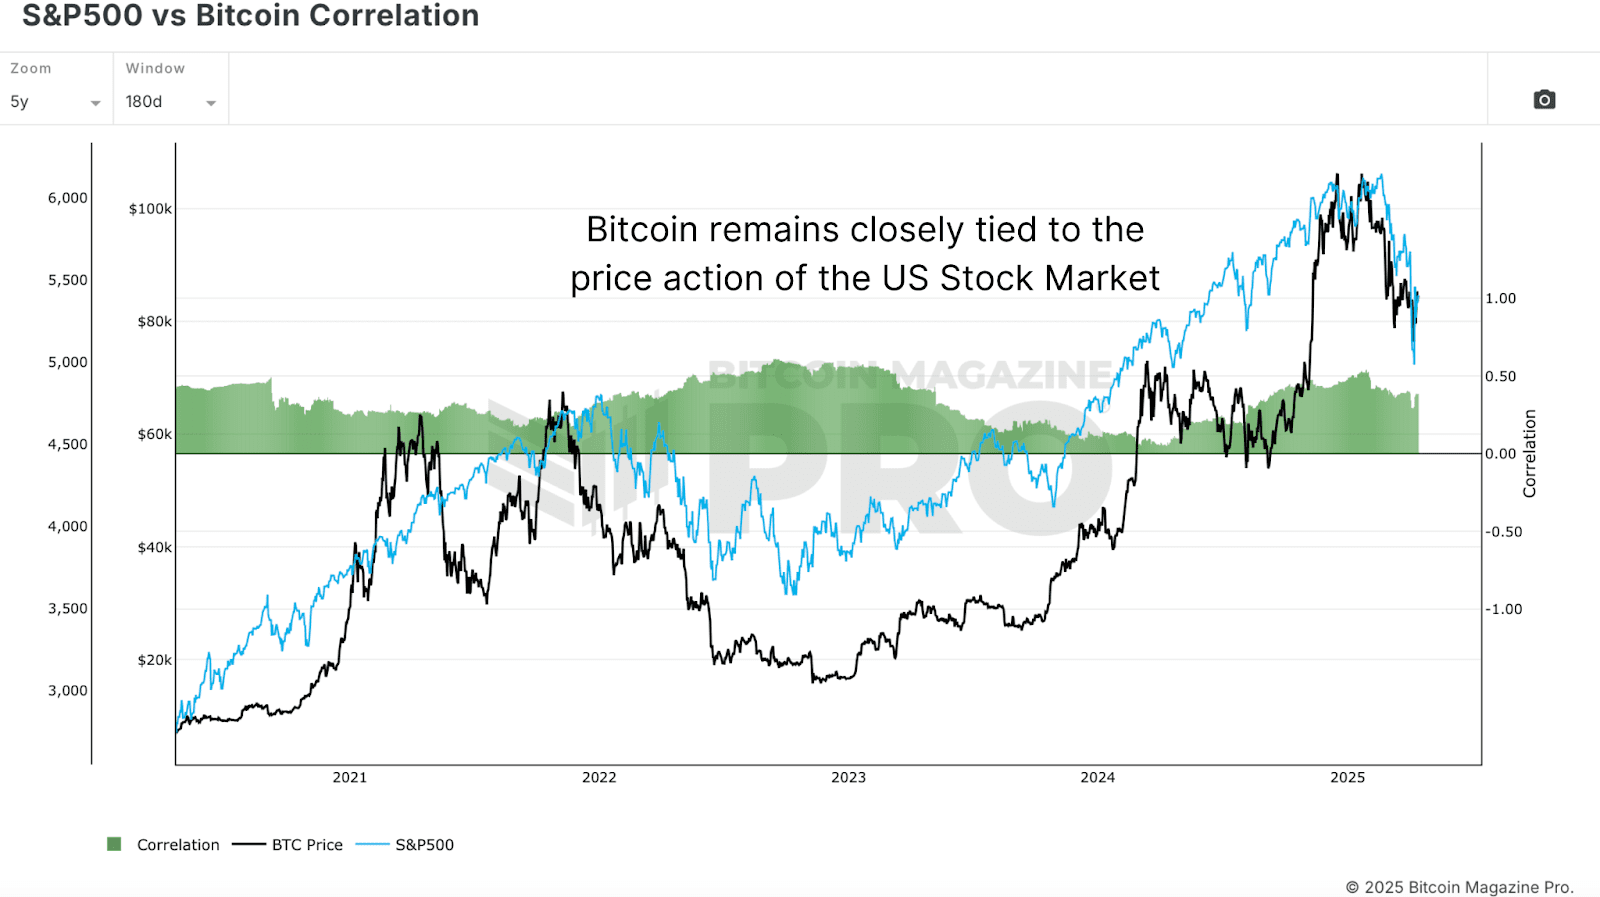
Monitoring these macro risks is crucial, as a deteriorating equity market could trigger a deeper Bitcoin correction in Q3 2025, even if on-chain data remains supportive.
Conclusion: Bitcoin’s Q3 2025 Outlook
Key on-chain indicators—MVRV Z-Score, Value Days Destroyed, and Bitcoin Cycle Capital Flows—point to healthy, cycle-consistent behavior and long-term holder accumulation in the 2025 Bitcoin cycle. While slower and uneven compared to past bull markets, the current cycle aligns with historical Bitcoin market cycle structures. If macro conditions stabilize, Bitcoin appears poised for another leg up, potentially peaking in Q3 or Q4 2025.
However, macro risks, including equity market volatility and recession fears, remain critical to watch. For a deeper dive, check out this YouTube video: Where We Are In This Bitcoin Cycle.
For more deep-dive research, technical indicators, real-time market alerts, and access to a growing community of analysts, visit BitcoinMagazinePro.com.

Disclaimer: This article is for informational purposes only and should not be considered financial advice. Always do your own research before making any investment decisions.